S&P500 Daily Action Areas & Price Targets 30/10/26

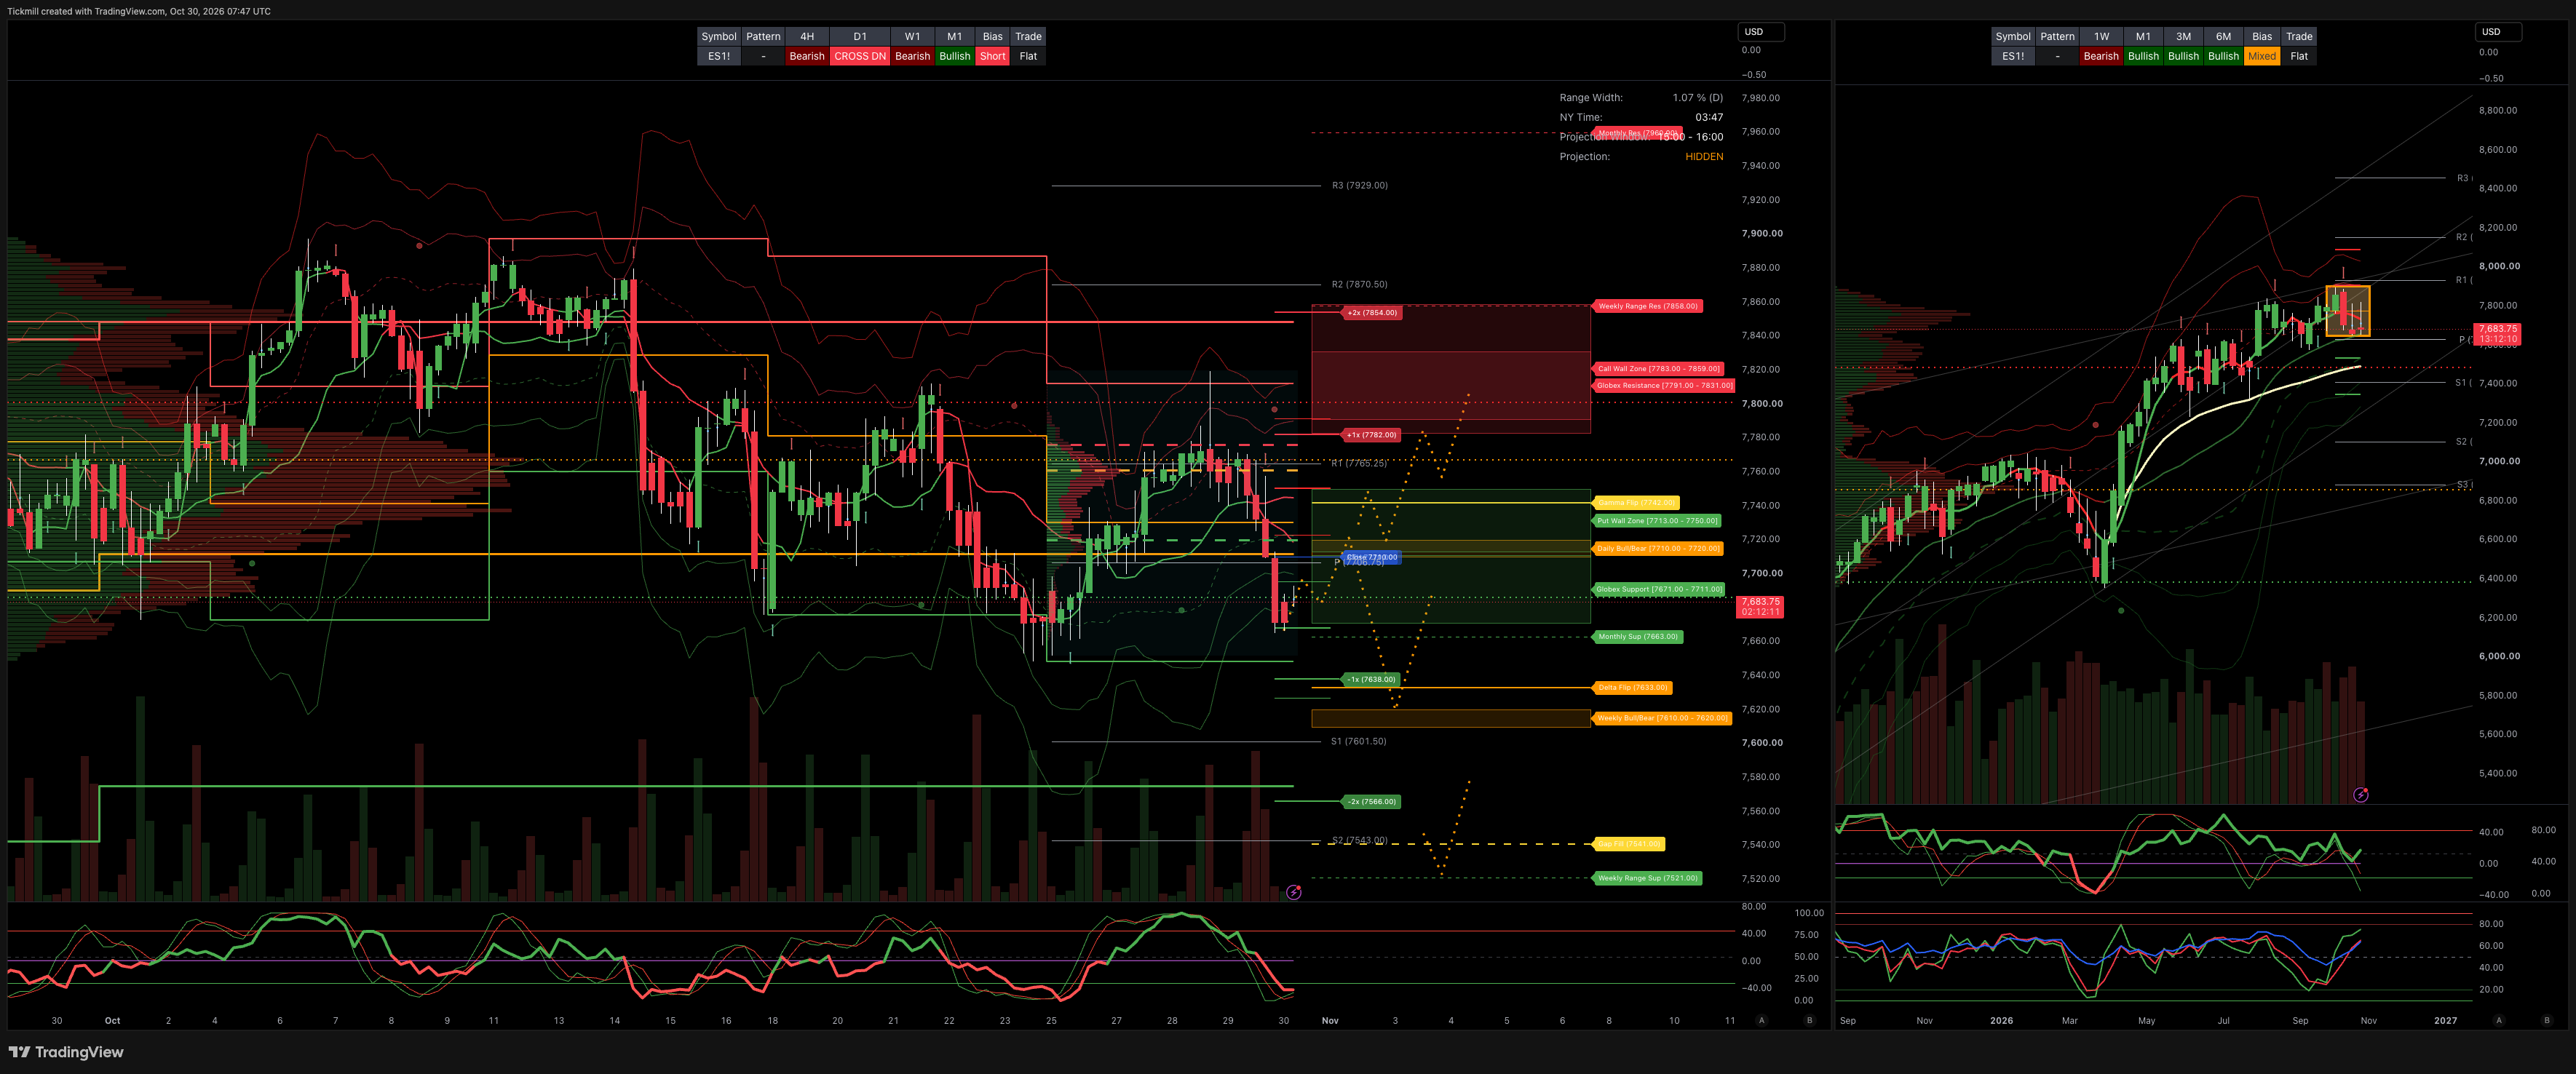
S&P500 Daily Action Areas & Price Targets 30/10/26
***QUOTING ES1!(Z CONTRACT LEVLES) FOR CASH US500 EQUIVALENT LEVELS, SUBTRACT POINT DIFFERENCE***
MONTHLY-WEEKLY& DAILY LEVELS
MONTHLY BULL BEAR ZONE 7440/7400
MONTHLY RANGE RES 7960 SUP 7663
WEEKLY BULL BEAR ZONE 7620/10
WEEKLY RANGE RES 7858 SUP 7521
DAILY BULL BEAR ZONE 77110/20
GLOBEX RANGE SUP 77711/7671 RES 7791/7831
GAMMA FLIP 7742
DELTA FLIP 7633
CALL WALLS 7783/7859
PUT WALLS 7713/7750
GAP FILL 7541
DAILY STRUCTURE - BALANCE 7794/7712
WEEKLY STRUCTURE - BALANCE - 7897/7575
MONTHLY STRUCTURE - OTFH - 7542
VIX BULL BEAR ZONE 18.72
VVIX-to-VIX The ratio of 5.32 compression is the main market driver, with the VVIX dropping more than the VIX, maintaining the ratio within the 5.0 to 6.0 range. This indicates a decrease in short-term tail risk insurance premiums, favoring volatility-selling strategies. Above 6.0 – 7.0+ signals higher risk and demand for options due to market volatility concerns.
PRIMARY TRADES & TARGETS
SHORT ON REJECT/RECLAIM DBBZ TARGET > DELTA/WBBZ
LONG ON REKECT/RECLAIM DELTA/WBBZ TARGET CLOSE
***ADDITIONAL SETUPS & TARGETS HIGHLIGHTED ON THE CHARTS***
(I FADE TESTS OF 2 SIGMA LEVELS ESPECIALLY INTO THE FINAL HOUR OF THE NY CASH SESSION AS 90% OF THE TIME WHEN TESTED THE MARKET WILL CLOSE ABOVE OR BELOW THESE LEVELS)
SPX PUT/CALL RATIO 1.10 (The numbers reflect options traded during the current session.) A put-call ratio below 0.7 is generally considered bullish, and a put-call ratio above 1.0 is generally considered bearish.
JHEQX Upside cap (~7,920–7,950): Dealer gamma hedging at this call strike creates resistance, with market makers likely selling futures into strength and limiting volatility. Downside cushion (~7,270): If SPX drops 5% into Q4, long put gamma may force dealers to buy futures as the index falls, helping stabilize prices. Expiration: December 31, 2026. Strong pinning effects are likely near key strikes into year-end expiration.
DEC2025 OPEX to DEC2026 OPEX is 945 points giving us a range of [5889,7779]
Notes On Structure Implications
Balance: This refers to a market condition where prices move within a defined range, reflecting uncertainty as participants await further market-generated information. Our approach to balance includes favouring fade trades at the range extremes (highs/lows) while preparing for potential breakout scenarios if the balance shifts.
One-Time Framing Higher (OTFH): This represents a market trend where each successive bar forms a higher low, signalling a strong and consistent upward movement.
One-Time Framing Lower (OTFL): This describes a market trend where each successive bar forms a lower high, indicating a pronounced and steady downward movement.
GOLDMAN SACHS FICC & EQUITY TRADING DESK VIEWS
EQUITY, DERIVATIVES & MACRO DESK BRIEFING: HYPERSCALER DISPERSION, ORACLE CREDIT PIVOT & POST-FOMC DYNAMICS
Source Document: US Sales Trading & Institutional Derivatives Desk (Ariana Contessa et al.)
Date: Late October 2026 (Pre-Market October 30, 2026)
THE TAKE: CAPITAL OVERHANGS CLEAR, ORACLE DEBT BLUEPRINT STABILIZES CREDIT & DEALERS RE-ENTER RANGE-BINDING GAMMA
US equities closed modestly higher across all major benchmarks (S&P 500 +28 bps to 7,744; Nasdaq-100 +55 bps to 29,813; Russell 2000 +15 bps to 2,823) as multiple structural overhangs cleared simultaneously: capital raises across Meta and SpaceX were absorbed, bellwether hardware prints (SK Hynix, Vertiv) reaffirmed robust underlying demand, and the Federal Reserve delivered an expected hold at 3.75%–4.00%.
The primary narrative shift centers on AI capital expenditure and funding visibility. While headline execution across hyperscalers showed dispersion—Google down -7% on consumer search deceleration (+12% vs. +14% cons) vs. Microsoft up +4% on accelerating Azure (+48% YoY)—the market has transitioned away from questioning capex durability toward demanding proof of capital returns and funding bounds.
Oracle’s Analyst Day provided an essential roadmap for levered infrastructure credit: management guided to $225B+ revenue and 40%+ operating margins by FY30, positive free cash flow in H2 FY28 stepping to $30B+ in FY29, with capex stepping down in FY29 and incremental capital raises hard-capped at $20B through FY30 (ex-refinancing). Demonstrating that the hyperscale funding cycle has an explicit endpoint is a major stabilizer for levered AI credit spreads.
MARKET SUMMARY & CROSS-ASSET SNAPSHOT
S&P 500 (SPX): Closed at 7,744.00 (+0.28%) | MOC $1.3B to SELL | VIX down -5.65% to 16.53 | Election Straddle (to next Tuesday close): 1.24%
Nasdaq-100 (NDX): Closed at 29,813.00 (+0.55%) | Outperformed on Microsoft post-market bid and semiconductor stabilization
Russell 2000 (RUT): Closed at 2,823.00 (+0.15%) | Small-caps maintained firm footing post-FOMC
Dow Jones (DJI): Closed at 52,476.00 (+0.19%) | Modest consolidation across value components
US 10-Year Treasury: Yield unch at 5.0217% | Yields held flat following the FOMC rate hold
WTI Crude: Price up +1.39% to $101.27/bbl | Remained elevated above $101/bbl on Middle East diplomatic tensions
Gold: Price up +0.50% to $4,072.00/oz | Modest bid amid easing US Dollar Index (DXY 102.16)
Bitcoin: Price up +1.15% to $81,584.00 | Range-bound accumulation
CENTRAL BANK POLICY: FOMC RECAP & ECB OUTLOOK
Federal Reserve Hold (3.75%–4.00% Target Range):
FOMC held rates steady with two hawkish dissents: Governor Cook and Cleveland Fed President Hammack voted for a 25 bps hike.
Statement upgraded economic assessment from "solid" to "strong" pace of expansion, while reiterating that inflation remains elevated.
Chair Warsh highlighted tighter financial conditions (FCI) early in the press conference, suggesting credit market tightening is doing policy work. OIS curves maintain an ~85% probability of a December rate hike.
ECB Policy Decision:
Having hiked twice since June, the ECB confronts high European natural gas prices touching €100/MWh against sovereign spread stress in French OATs.
Lagarde's posture on whether tighter sovereign financial conditions substitute for rate hikes will dictate whether December brings another increase.
TECH & HARDWARE READ-THROUGH: ORACLE, HYPERSCALERS & SEMIS
Oracle (
ORCL+10%): Outlined high-20s project returns on fully ramped gigawatts (~$16B annualized revenue per GW), showing a clear transition from endless capital burn to bounded capital investment.Microsoft (
MSFT+4% AH): Reported Total Revenue up +19% YoY cc (vs. +17% prior) with Azure accelerating to +48% YoY (vs. +43% prior), validating enterprise AI workload adoption.Alphabet (
GOOGL-7% AH): Cloud revenue expanded solidly, but Search growth slowed to +12% YoY (vs. +14% expected), feeding into generative AI search-displacement fears.Hardware & Testing: Advantest rallied on a major guidance boost, while Samsung lagged following disappointing shareholder capital return updates post-Hynix.
INSTITUTIONAL FLOWS & DERIVATIVES STRATEGY
Trading Floor Execution (4/10 Activity Rating):
Asset Managers and Hedge Funds finished as small net buyers.
For the first time in nearly a month, the desk observed green shoots of genuine offensive buying in AI/Semiconductors, predominantly driven by Long-Only (LO) accounts stepping into de-risked quality names.
Derivatives & Volatility Surface:
Option Volatility Crushed: Implied volatility was offered across both SPX and NDX curves post-FOMC, with skew relaxing slightly as spot equity averages advanced.
Topside Call Buying Resumes: Bullish flow re-emerged above YTD averages. Flows featured outright calls and vertical call spreads in tech, highlighted by sizable institutional buying in ORCL 6Nov and 27Nov Call Spreads.
Topside Dealer Gamma Range-Bound Collar: Market makers remain heavily net long gamma to the topside, effectively pinning the S&P 500 to its current range and suppressing breakout velocity.
Implementation Preference: The vol desk continues to prefer Nasdaq-100 (
NDX) call spreads over S&P 500 structures to express tactical upside into the November corporate buyback ramp.
Disclaimer: The material provided is for information purposes only and should not be considered as investment advice. The views, information, or opinions expressed in the text belong solely to the author, and not to the author’s employer, organization, committee or other group or individual or company.
Past performance is not indicative of future results.
High Risk Warning: CFDs are complex instruments and come with a high risk of losing money rapidly due to leverage. 68% and 74% of retail investor accounts lose money when trading CFDs with Tickmill UK Ltd and Tickmill Europe Ltd respectively. You should consider whether you understand how CFDs work and whether you can afford to take the high risk of losing your money.
Futures and Options: Trading futures and options on margin carries a high degree of risk and may result in losses exceeding your initial investment. These products are not suitable for all investors. Ensure you fully understand the risks and take appropriate care to manage your risk.
Patrick has been involved in the financial markets for well over a decade as a self-educated professional trader and money manager. Flitting between the roles of market commentator, analyst and mentor, Patrick has improved the technical skills and psychological stance of literally hundreds of traders – coaching them to become savvy market operators!